Brain Images of Normal Subjects
Web Application User Guide
Version 1 @ 04.02.2016
Introduction
The Brain Images of Normal Subjects (BRAINS) Imagebank website is designed to provide detailed structural brain imaging data of healthy individuals across the human life-course. The website is a searchable database of integrated data sets already collected as part of research studies which include healthy (or control) subjects. These studies include detailed MRI using a range of sequences, and associated data, e.g. pregnancy details (for neonatal data), demographic details, current and prior socioeconomic status, education, health, medication use and cognitive tests.
This document guides a user through the process of searching the database and making a request to the steering committee for approval in order to be able to access the data.
Requirement
The application has so far been tested and should run on the following internet browsers:
-
Internet Explorer 8+
-
Mozilla Firefox
-
Chrome
-
Safari
Homepage
Figure 1 is the homepage of the BRAINS website. This page is accessible by typing the URL into a web browser: www.brainsimagebank.ac.uk
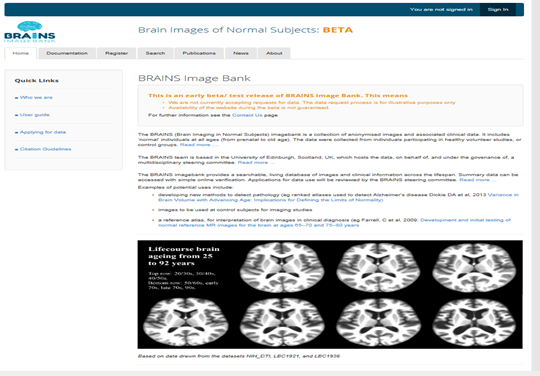
Figure 1. Homepage of the BRAINS website.
The various functionalities listed above will subsequently be covered in detail. The ‘Quick Links’ provides a quick access to some pages are also covered.
User Account
The website requires an account to be created before data can be searched and requested. This is achieved by a one-time registration process and a subsequent user account validation.
User Registration
Click on the ‘Register’ from the homepage to create an account and Figure 2 will be displayed.
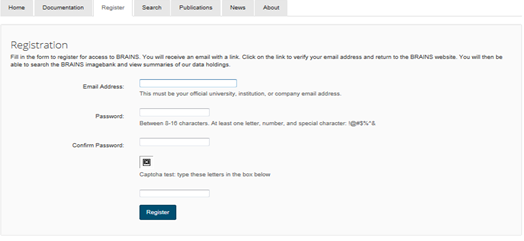
Figure 2. Registration page
Once the registration page is displayed:
- Please provide a valid email address, which should be from an official institution such as a university or a company email address; personal email addresses cannot be accepted.
- Provide a password taking note of the format as advised (Between 8-16 characters. At least one letter, number, and special character: !@#$%^&).
- Repeat the password in the ‘confirm password’
- Type the letter displayed in the box – case sensitive
- Click on ‘Register’
Upon successfully completing the above process, an email will be sent to the email address provided. Please click on the link provided in the email which will take you to the screen in Figure 3.
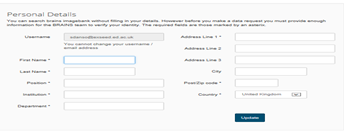
Figure 3. Personal details of a User
Figure 3 shows the additional information to be collected before data can be requested. If you leave those details blank you will only be able to carry out data searches.
Update User Details
The personal details page can also be updated at any time once an account has been created. This is by clicking on ‘Account’ as shown in Figure 4 which is only accessible upon registration and login.
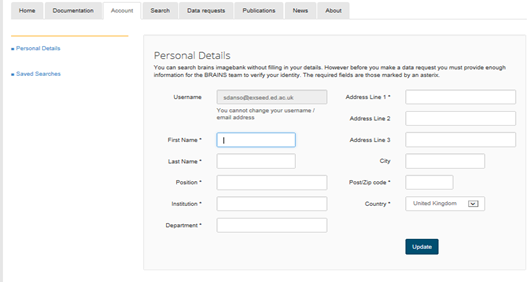
Figure 4. Homepage with ‘Account’ accessible page only available upon login.
Please note that the fields with the asterisks (*) are required before making a data request
Recover Password
It is possible to recover a password in the event of forgetting it. Figure 5.1 and 5.2 show steps required to have it recovered.
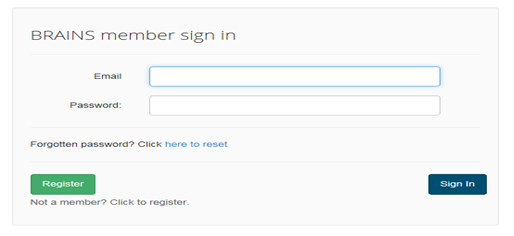
Figure 5.1 Step 1 of 2 of the recovering password
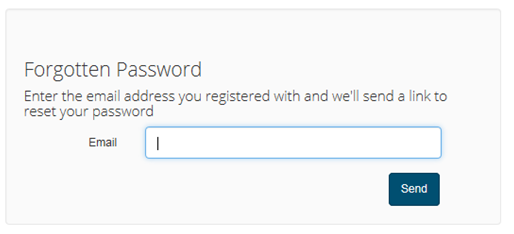
Figure 5.1 Step 2 of recovering password
- Figure 5.1 is the first page that is displayed to allow a password to be recovered. It is accessible after clicking on the ‘search’ tab from the home-page as shown in Figure 1.
- Click on ‘click to reset’
- Figure 5.2 will be displayed to provide the email used at the time of registration and click on ‘Send’
- Check your email and follow the instructions provided to reset your password
Automatic Log Off
It is worth noting that the Application automatically logs off after 30 minutes of inactivity. A user will be required to re-log in the event of an automatic log off.
Documentation
This provides links to the access the documents available for various purposes as shown in Figure 6.
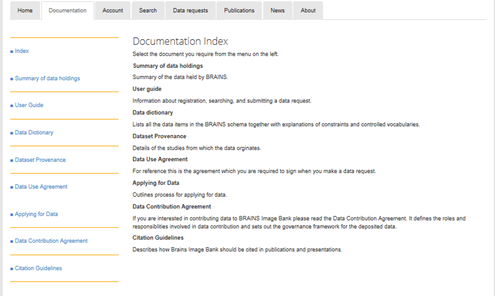
Figure 6. Documentation page
Data Dictionary
This page shows the summary of data currently available in the database. For example, at the time of production of this document the database had a total of 868 subjects obtained from 7 studies as Figure 5 shows. See ‘Dataset Provenance’ for information about the individual studies listed.
-
Data Dictionary: a description of data items in the BRAINS schema together with explanations of constraints and controlled vocabularies. It also shows the mappings and schemes used to group the various data items. For example, cognitive tests such as NART and Moray House Test have been grouped as ‘General Intelligence’ and therefore selecting ‘General Intelligence’ as part of a search criteria should include the various tests grouped as such.
-
Dataset Provenance: details of the studies from which the data originates.
-
Data Access Agreement: this is an agreement form required to be signed when making a data request.
-
Applying for Data: outlines process for applying for data.
-
Data Contribution Agreement: this defines the roles and responsibilities involved in data contribution and sets out the governance framework for the deposited data.
-
Citation Guidelines: this describes how the BRAINS Imagebank should be cited in publications and presentations.
Summary of data holdings: summary of the data held by BRAINS as shown in Figure 7.
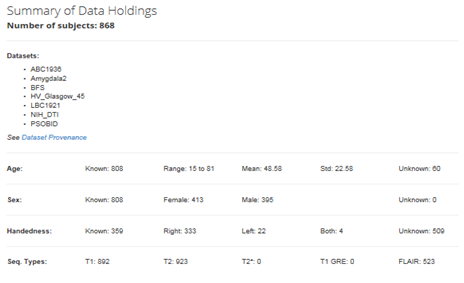
Figure 7. Summary of data
Publications
Every effort is made to keep the website up to date with all information related to journal publications and oral and poster conference presentations. The ‘Publications’ page provides the list of all the information about publications since the beginning of the BRAINS project grouped by year of publication as shown in Figure 8.
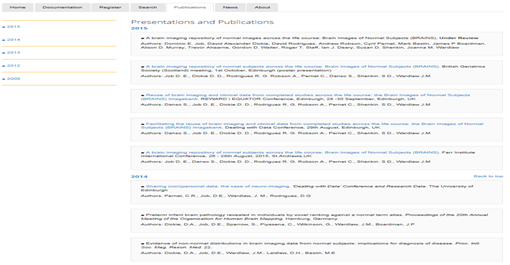
Figure 8. Publications page with example of information contained
News
Public engagement is an integral part of the activities carried out by the BRAINS team. All information related to these activities such as press releases, summer training opportunities for students are available on the ‘News’ page as shown in the Figure 9.
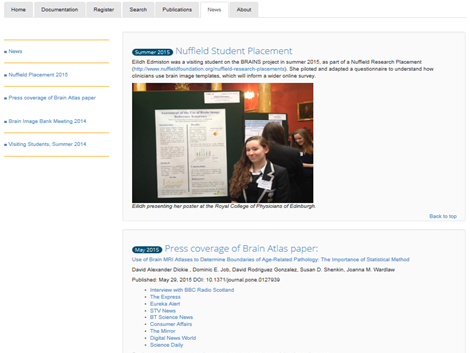
Figure 9. News page with example of news items featured
About
Figure 10 shows the ‘About’ page which provides general information about the BRAINS project. This include members of the steering committee and the BRAINS team. Information about how to contact the BRAINS team is also available from the ‘Contact us’ section.
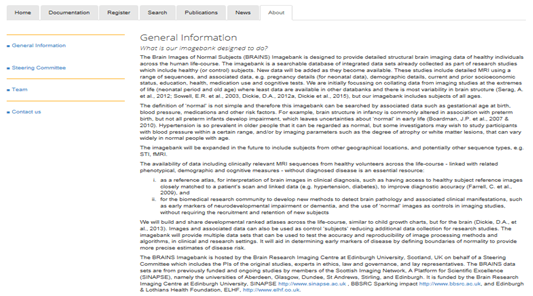
Figure 10. The ‘About’ page
Data Search
The ‘Search’ page is used to search and make a data request.
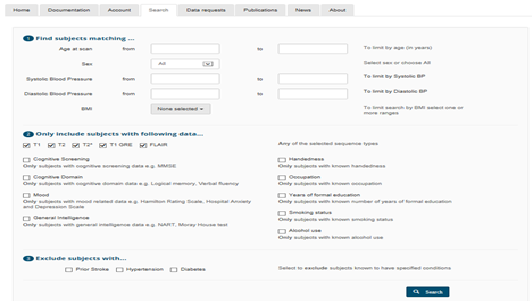
Figure 11. Search page
Figure 11 shows the search page which allows the criteria for the search to be specified. Please note that this page is only accessible after a successful login. The search has three parts:
- Find subjects matching: this allows age, sex and blood pressure parameters as captured at the time of scan to be specified as shown in Figure 11.1
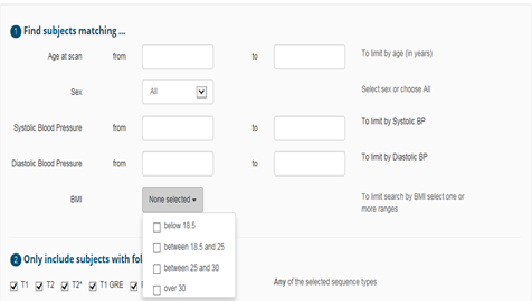
Figure 11.1. Step 1 of the search process.
The BMI of the subjects of interest can be selected from the predefined ranges:
- Below 18.5
- Between 18.5 and 25
- Between 25 and 30
- Over 30
Leaving these fields blank will result in the default which is selecting all records without restriction.
2 . Sequence types and additional criteria
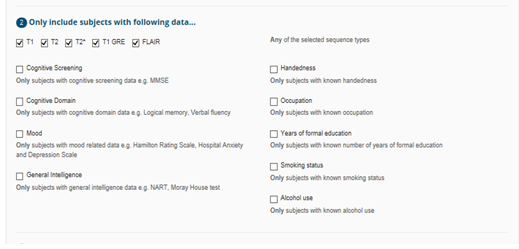
Figure 11.2. Step 2 of the search process.
Figure 11.2 is step 2 of the search process that shows the criteria for specifying a search. This includes specifying further parameters such as the sequence type of the images, handedness, occupation; years of education; smoking status and alcohol use. Additionally, variables related to various cognition domains can also be specified: cognition screening, cognitive domain, mood and general intelligence. Please see ‘Data Dictionary’ for the various tests under each of the domains listed. Also, note that further filtering may be required to exclude data depending on the research question. For example, selecting ‘Years of formal education’ will return all records that contain data and may therefore require selecting the specific years of education. It must also be noted that at least one MRI sequence type must be selected for the search.
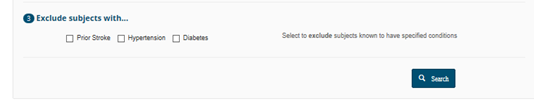
3 .**Excluding criteria**
Figure 10.3 shows the last step of the search process. This allows subjects with conditions such as prior stroke, hypertension and diabetes to be excluded before a final list is generated.
Data Search Example
Considering the complex nature of the data and queries being dealt with, it is not possible to cover all scenarios. However, it is hoped that the example being used to explain the search output would help in explaining any other search outputs. Figure 8 shows an example of a query: we want to retrieve all subjects with any T1, T2, T2* or FLAIR sequence type; data on General Intelligence and Handedness; but exclude patients with known history of diabetes.
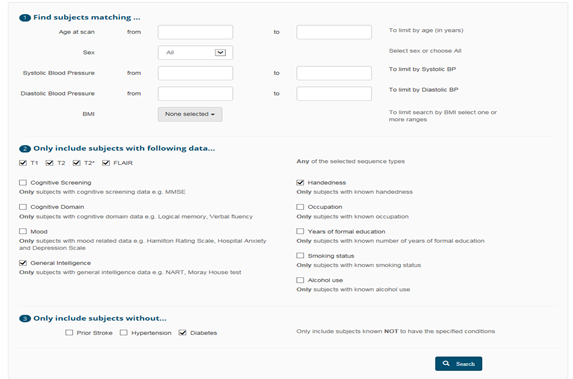
Figure 12. An example of a search use case
Search Output Explained
The search output has eight sections and these are described.
Summary of Query
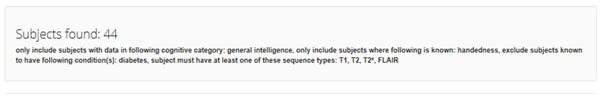
Figure 12.1 the ‘Summary of Query’ – section 1 of 8 Figure 12.1 shows the ‘Summary of Query’ section of the search output page. This section shows the query run from the example described in Figure 8. As the figure shows 44 subjects match the search query.
Key Fields Summary
Figure 12.2 shows the output of the search with basic summary of ‘Age’, ‘Sex’, ‘Handedness’ and ‘Sequence Types’, which are considered ‘Key Fields’ and are presented in every search output. The search respectively shows the ‘Known’ and ‘Unknown’ values to indicate the number of subjects with data and without data for a given field. Additionally, the range, mean and standard deviations are also presented where applicable. The ‘Sequence Types’ also show the number of subjects for each type. These values are in relation to the total number of subjects retrieved.
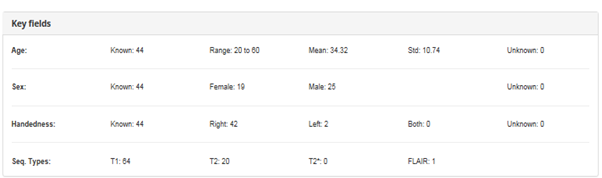
Figure 12.2 ‘Key Field’ search query output – section 2 of 8
So in the example presented above, out of the 44 subjects found to match our query, all the 44 subjects have data for ‘Age’, ‘Sex’ and ‘Handedness’ with age range 20 to 60; sex distribution (female= 19 and males = 25); and Handedness distribution (Left = 2, Right=42 and Both = 0). The distribution of Sequence Type are: T1=64, T2=20, T2*=0, and FLAIR=0. Note that it is possible for a subject to have multiple sequences, hence, the reason for T1 and T2 appear to be more than the number of subjects found.
Demographics Summary
Figure 12.3 shows the ‘Demographics’ summary of the search query result. As the figure shows, ‘Occupation’ and ‘Years of formal education’ are the fields listed under ‘Demographics’. There is also an “Expand/Collapse” functionality available to this and other sections to be described that allows the fields contained in these sections to be visible or hidden by clicking on it. This functionality can be useful when dealing with many fields to focus on the output of a particular section at a time.
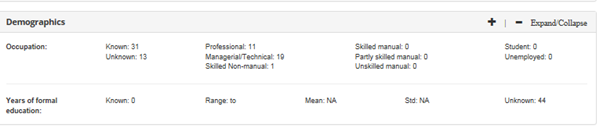
Figure 12.3 ‘Demographics’ search query output – section 3 of 8 As the figure shows that 44 subjects have data on ‘Occupation’ whereas 13 of them do not. A breakdown of those with data is also given based on the categories described in the Data Dictionary: ‘Professional’= 11, ‘Managerial/Technical’= 19, ’Skilled Non-manual’: 1 and ‘Skilled manual’= 0, ‘Partly skilled manual’= 0, ‘Unskilled manual’= 0, ‘Student’=0, and ‘Unemployed’=0. However, there were no subjects with data on ‘Yeas of formal education’ resulting in all the 44 subjects being recorded as ‘Unknown’ and also nothing is shown for range and standard deviation as these are not applicable.
Physical Measurements Summary
Figure 12.4 shows ‘Physical Measurements’ search results and this include ‘Systolic Blood Pressure’, ‘Diastolic Blood Pressure’ and ‘BMI’. Again, a typical search output will provide a summary of the number of subjects (with respect to the number of subjects found to match the search query) data available and unavailable as well as ranges and standard deviations where applicable regarding these fields. The distribution of subjects with data on ‘BMI’ among the groupings are also given.
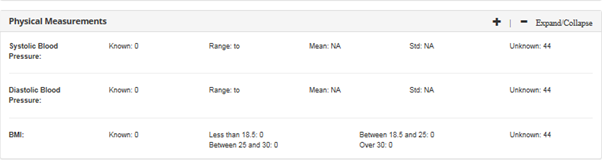
Figure 12.4 ‘Physical Measurements’ search query output – section 4 of 8
As Figure 12.4 shows from our search example, data was unavailable on ‘Systolic Blood Pressure’, ‘Diastolic Blood Pressure’ as well as ‘BMI’ for all the 44 subjects retrieved. This resulted a BMI distribution: Less than 18.5 = 0 subjects; between 18.5 and 25 = 0 subjects; between 25 and 30 =0 subjects; Over 30 = 0.
Medical History Summary
Figure 12.5 shows the ‘Medical History’ summary of search output where data on ‘Hypertension’, ‘Prior stroke’ and ‘Diabetes’ are considered. For those fields with data available, further information is provided on the number of subjects, with ‘Yes’ and, without ‘No’, the medical conditions. The number of subjects without data is also given.
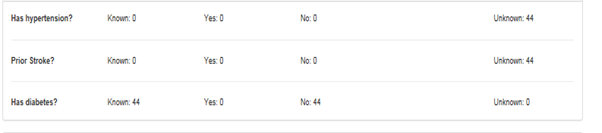
Figure 12.5 ‘Medical History’ search query output – section 5 of 8
As the figure shows from our example, based on the number of subjects retrieved, 44 subjects have data on diabetes. However, all the 44 subjects do not have history of diabetes. There was no data available for all the 44 subjects for ‘Hypertension’ and ‘Prior stroke’ and these have been recorded as ‘Unknown.’
Lifestyle Measures Summary
Figure 12.6 shows the ‘Lifestyle Measures’ section of the search output. This contains information about smoking and alcohol consumption. For those subjects with data on smoking, a breakdown of the number of subjects that ever, currently, not currently, never as well as previously smoked are given. Similarly, the number of subjects with data on alcohol consumption units per week as well the range, mean and standard deviations are given. The number of subjects with data on these fields are recorded as ‘Unknown’. With regards to smoking, it must be noted that there is a subtle difference between ‘not current’ and ‘previous’ and must be interpreted with within the context of the point of data collection: ‘Not current’ refers to the day of data collection.
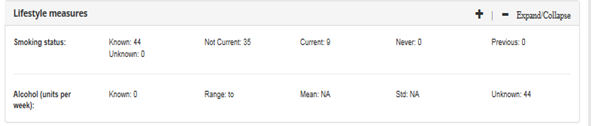
Figure 12.6 ‘Medical History’ search query output – section 5 of 8
Cognitive Tests Summary
Figure 12.7 shows the list of all the cognitive tests data collected as part of the imagebank. As previously indicated these tests have been categorised into four search domains: cognition screening, cognitive domain, mood and general intelligence with the various mappings provided in the data dictionary.
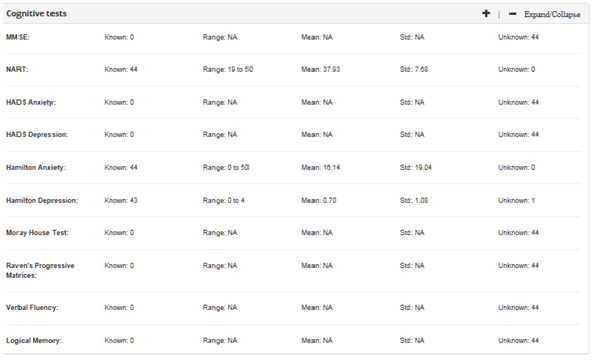
Figure 12.7 ‘Cognitive Tests’ search query output
From our search example, all 44 subjects have MMSE, ‘HADS Anxiety’, ‘HADS Depression’, ‘Moray House Test’, ‘Raven's Progressive Matrices’, ‘Verbal Fluency’ and ‘Logical Memory’ recorded as ‘Unknown’ as none of the subjects that matched our search criteria has data on these fields. On the other hand, all 44 subjects found have data on NART as required by the search criteria, with scores range= 19 to 50, mean = 37.9 and standard deviation = 7.63. Furthermore, 44 subjects were found to have data on ‘Hamilton Anxiety’, with range = 0 to 50, mean = 16.14 and standard deviation = 19.04. Finally, 43 subjects were found to have data on ‘Hamilton Depression’, with range = 0 to 4, mean = 0.70 and standard deviation = 1.08. However, 1 subject did not have data on ‘Hamilton Depression’ based on the search query.
Saving Query Search
It is possible to save a search query for future use and/or as part of a data request. Figure 8.8 shows the section of the search output page where this can be done.

Figure 12.8 ‘Saving’ query Search
As the figure shows, the preferred name of the search is to be keyed into the space provided. The ‘Save’ button should then be clicked upon providing a name.
Re-run Saved Search
To be able to re-run a search query, click on ‘Account’ and then ‘Saved Searches’. As the figure shows, the page provides details of all saved searches: date saved, the name and the query summary. Click on the ‘Select’ option provided to re-run a specific search query. Figure 13 shows the page use to access saved search queries.
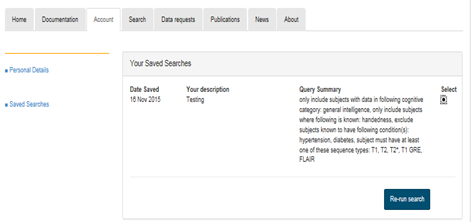
Figure 13. A re-run of saved search example
To be able to re-run a search query, click on ‘Account’ and then ‘Saved Searches’. As the figure shows, the page provides details of all saved searches: date saved, the name and the query summary. Click on the ‘Select’ option provided to re-run a specific search query.
Data Request
Figure 14 shows the ‘Data Request’ page used for making data requests.
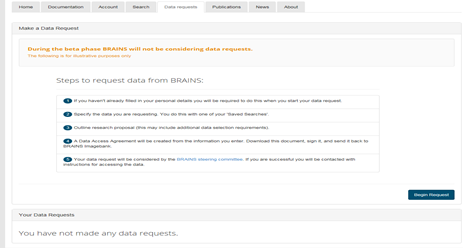
Figure 14. ‘Data Request’ page
As the figure shows, a request can be made by the following steps: Up-to-date details have been provided (see Figure 4); a search query has been created and saved; a signed ‘Data Access Agreement’ form and research proposal outline completed. This request will then be reviewed for approval by the BRAINS Steering committee.
The Data Request process starts with up-to-date mandatory details provided. Click on the ‘Begin Request’ button to proceed. Figure 14.1 shows the ‘Data Selection’ page for the data request process.
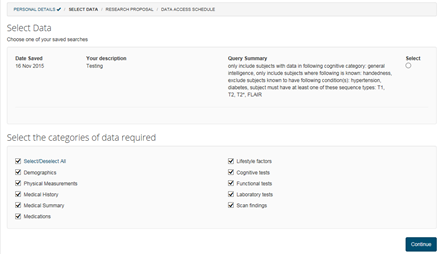
Figure 14.1 ‘Data Selection’ page
Figure 14.1 shows, the list of search queries that have been saved. One of these saved queries can be selected from using the ‘select’ radio button. Additionally, options are provided for selecting the categories of data required to be delivered from a list. Clicking on ‘Continue’ will move to the next stage - display of the ‘Research Proposal’ form as shown in Figure 14.2
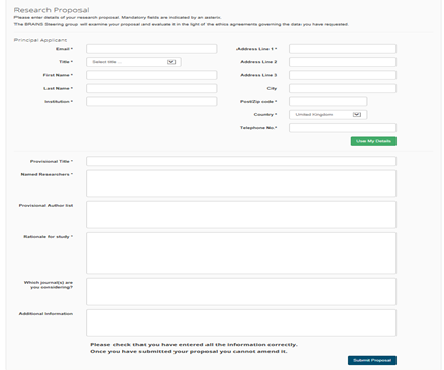
Figure 14.2 ‘Research Proposal’ page
As the figure shows, the research proposal requires information about the Principal Applicant. If this is the same as the person registered, the ‘Use my details’ can be used to populate the ‘Principal Applicant’ fields. Additionally, information required to be provided include: provisional title, names of researchers to work on the proposed project, provisional author list, rationale for the study, journals that are being considered for publication of the proposed research, and any additional information that one may wish to provide as part of the proposal to be considered by the BRAINS Steering committee. The proposal can be submitted using the ‘submit proposal’ button.
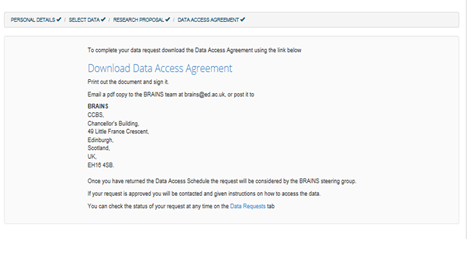
Figure 14.3 ‘Research Proposal Submission Confirmation’ page
Figure 14.3 is the confirmation page once the proposal is submitted. As the figure shows the ‘Data Access Agreement’ form can then be downloaded, signed and sent to the BRAINS Steering committee for consideration.
Figure 14.4 shows details of data requested. This includes the summary of the search query, the reference code assigned to the request, and the status of the submitted request.
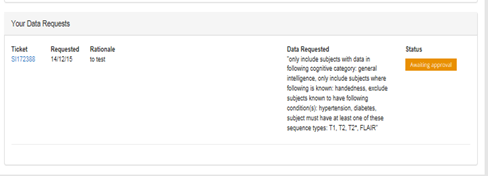
Figure 14.4 ‘Details of data requested’ page
As the figure shows the data request made has been assigned a code ‘ticket number SI172388’; the request was made on 14/12/1015 and the rationale for the project is indicated as ‘to test’ which was specified in Figure 10.2. Furthermore, the summary of the query generated and saved as described in the ‘Data Search’ section is shown. The figure also shows the status of the request made which is currently waiting for approval from the Steering committee.
Data Delivery
Once approval of a request has been granted, data will be prepared and delivered in DICOM and CSV formats for the images and associated clinical data, respectively. The prepared data will be deposited in a secured area using the University of Edinburgh DataSync. This data storage infrastructure is similar to Dropbox which is only accessible to the intended recipients. An email will be sent to the email address that was used to make the data request. The email will provide a unique URL which points to the data. Click on the URL to download the data.